
Product Sales Dashboard Using Ms Excel and Power BI
A data analytics bootcamp session at SideHustle


Table of contents


No headings in the article.
So I started a data analytics bootcamp session with @Sidehustle this week. Thank you to the founder @Drey for this fantastic chance. The first assignment assigned to us was to gather information on product sales, scrape data, clean it, and visualize it using MS Excel and PowerBI. This dataset was obtained from the Kaggle website.
I worked with an 8-person team and had the honor of serving as the group's assistant team leader.
Power Query was used to clean the data, and the DAX functions were utilized to calculate the KPIs to acquire in-depth insights from the dataset, as seen in the image below.
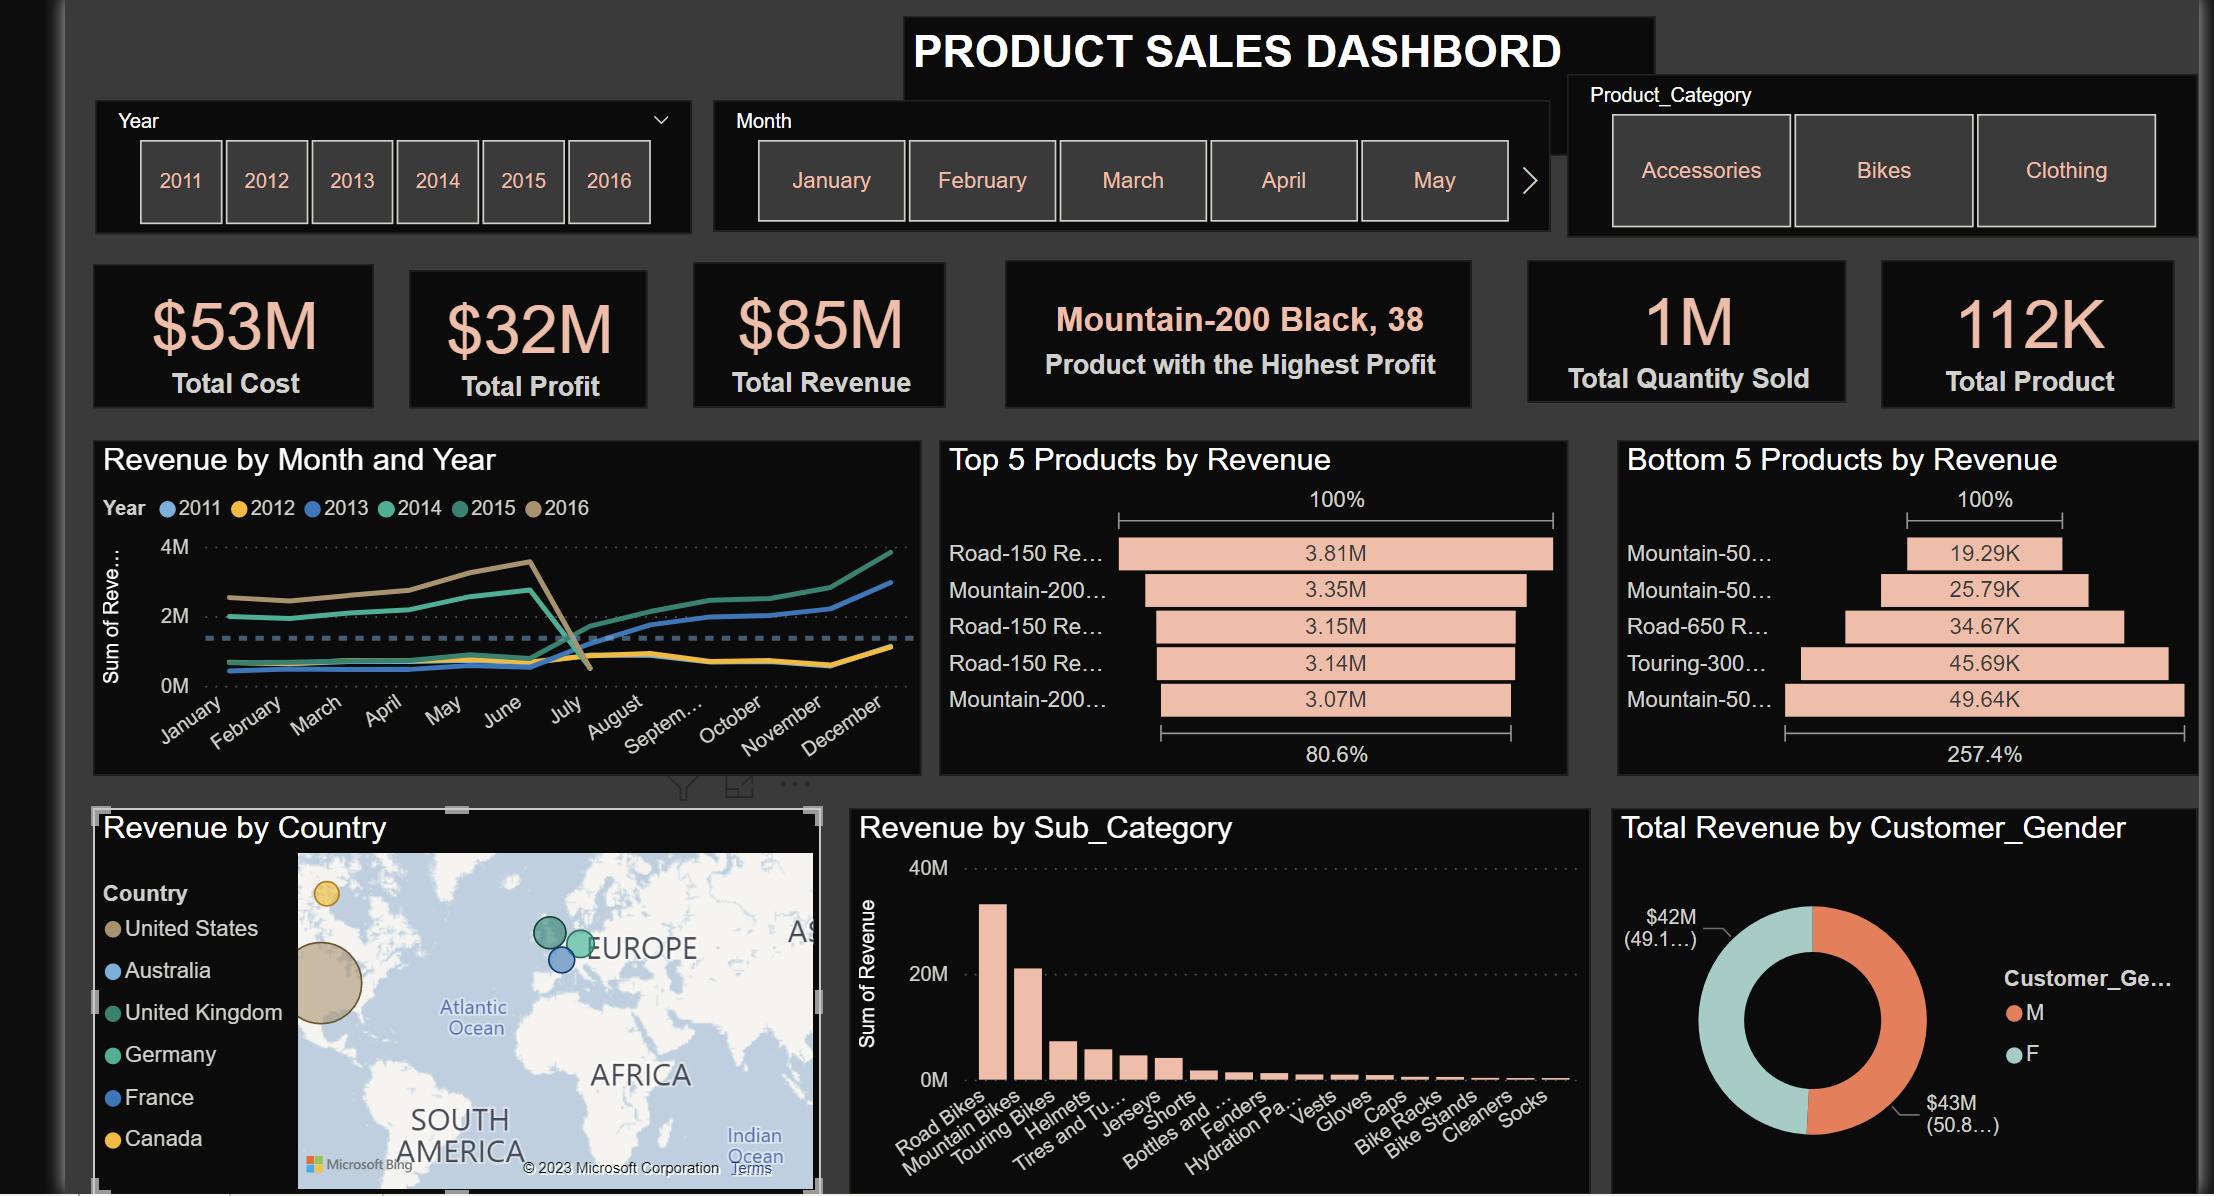
Some of the key insights generated are explained more below.
From 2011 to 2016, a total revenue of $85 million was generated, with accumulated profits of $32 million. The total quantity sold was 1 million, with Mountain-200 Black, 38 receiving the first product with the highest profit.
Road bikes have the largest revenue followed by Mountain bikes. It can also be seen that the male gender has 50.85% with a revenue of $43 million and the female gender has 49.15% with a revenue of $42 million. We strongly advise the company to target both genders for product advertising on all social media platforms, as this will allow them to create more revenue in the future.
Over the years, the product category "Clothing" has generated the least revenue $8 million, and a profit of $3 million. Jersey topped the subcategory statistics, followed by shorts, and socks made the least income of $141,171K.