Unicorn Company Report


Table of contents


No headings in the article.
This report aims to provide key insights into the valuation trends of unicorn companies from 2007 to 2022. The analysis was conducted using Microsoft PowerBI, leveraging data sourced from Quantum Analytics. The report covers key aspects of unicorn valuation, industry distribution, global presence, and notable company contributions, offering a holistic understanding of unicorn market dynamics.
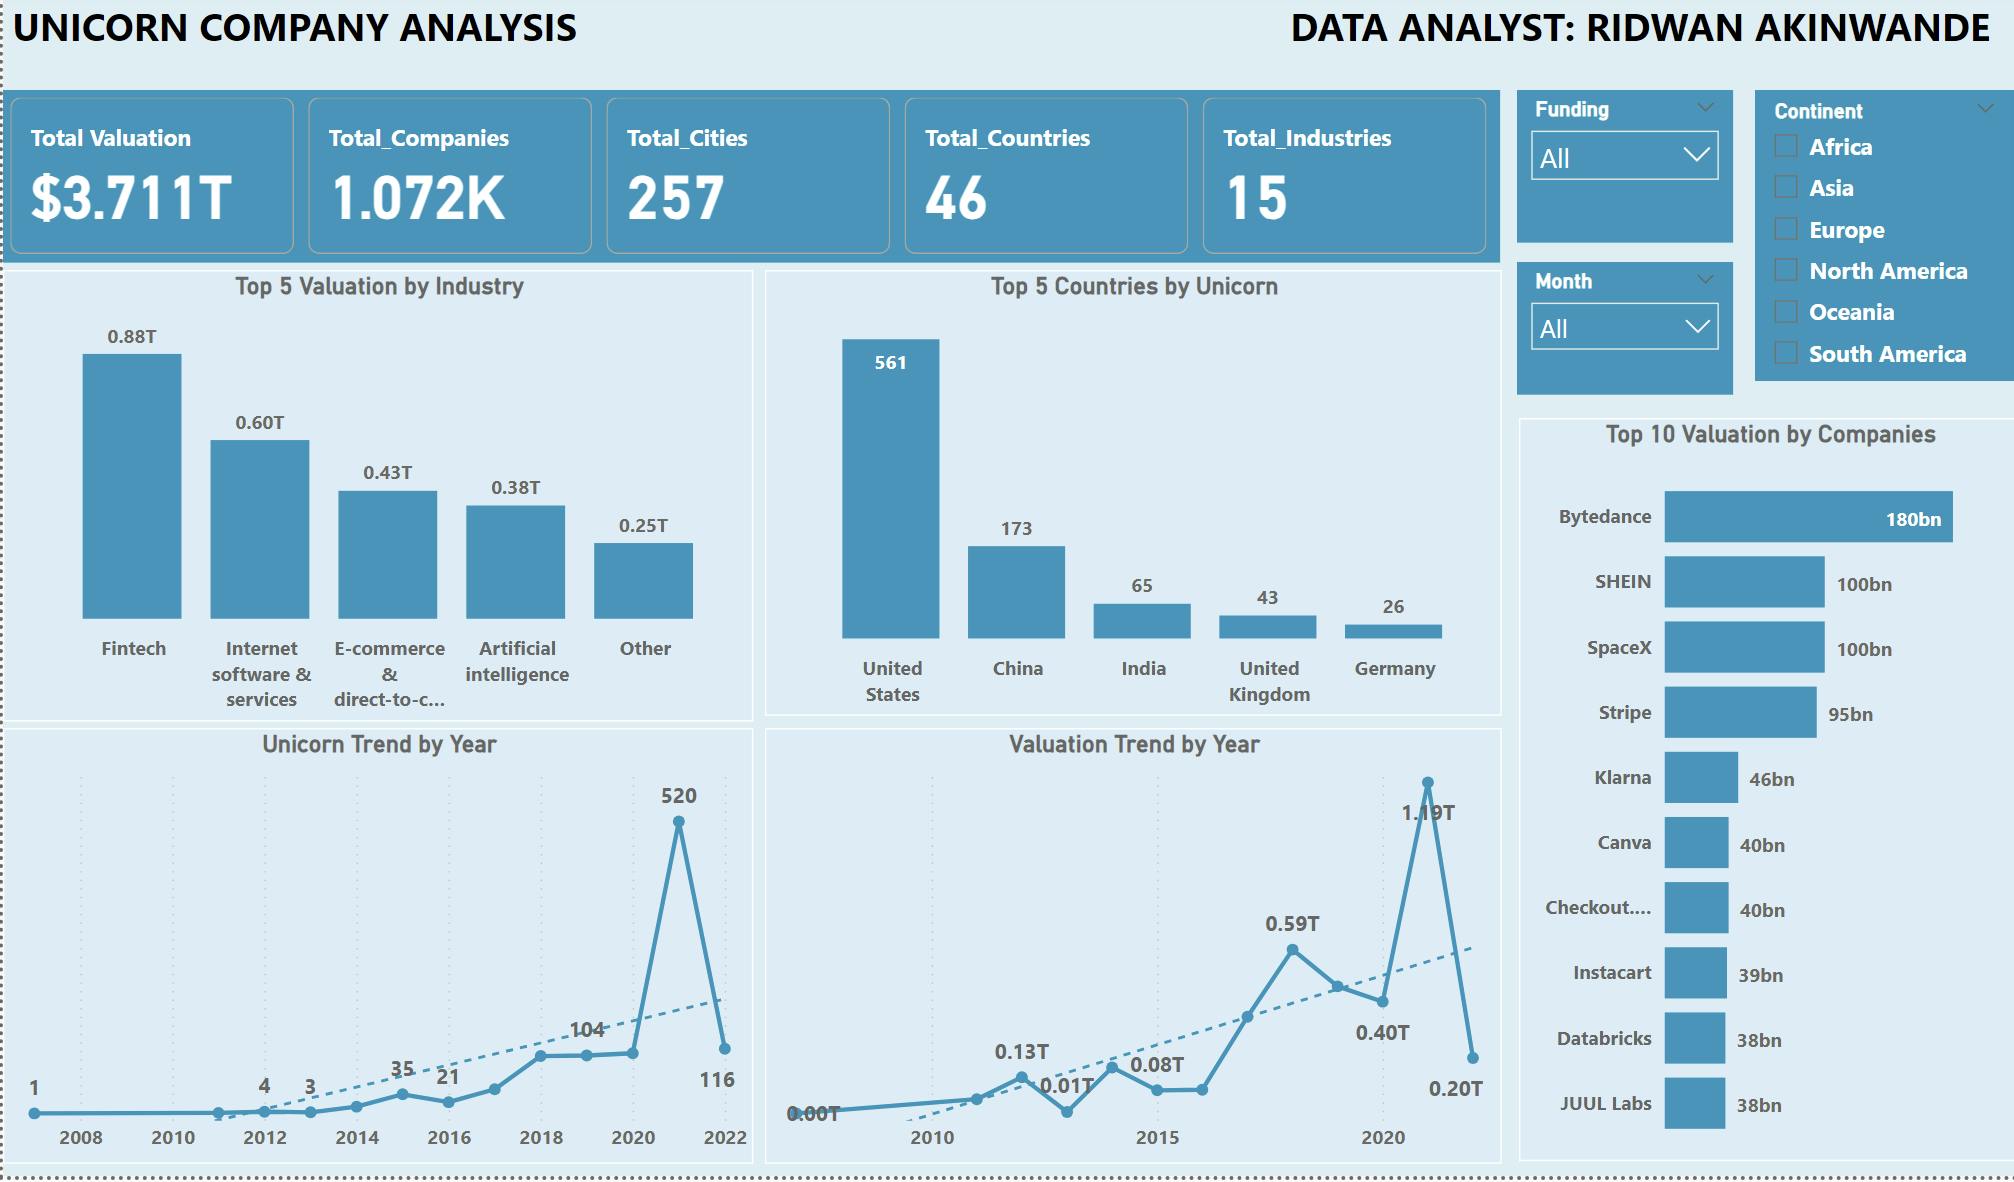
Total Unicorn Valuation: The combined valuation of unicorn companies stands at an impressive $3.711 trillion. This valuation is distributed across various industries, countries, and years, providing insights into the dynamics of the unicorn market.
Top 5 Valuation by Industry: Analyzing the unicorn landscape by industry, Fintech leads with a valuation of $882 billion, marking a substantial 250.00% increase over the lowest-valued sector, 'Other,' at $252 billion. Fintech contributes significantly, accounting for 34.83% of the total valuation. The valuation range across all five industries spans from $252 billion to $882 billion.
Key Performance Indicators (KPIs):
Fintech Valuation: $882 billion
Other Valuation: $252 billion
Fintech's Contribution to Total Valuation: 34.83%
Top 5 Countries by Unicorn: The United States leads the unicorn presence with 561 companies, exhibiting a substantial 2,057.69% difference from the country with the lowest count, Germany, which has 26 unicorn companies. The total unicorn count across the top five countries ranges from 26 to 561.
KPIs:
Total U.S. Unicorn Companies: 561
Total German Unicorn Companies: 26
Unicorn Trend by Year: The overall trend in unicorn company growth reveals a remarkable 11,500.00% increase between 2007 and 2022. Notably, the trend gained momentum in 2013, experiencing a 3,766.67% surge in nine years. The steepest incline occurred between 2013 and 2022, with unicorn companies soaring from 3 to 116.
KPIs:
Overall Growth (2007-2022): 11,500.00%
Growth from 2013-2022: 3,766.67%
Valuation Trend by Year: The total valuation of unicorn companies surged by an impressive 19,900.00% from 2007 to 2022. The valuation trend started ascending in 2015, witnessing a substantial 138.10% increase in seven years. The most significant leap occurred between 2015 and 2022, catapulting the valuation from $84 billion to $200 billion.
KPIs:
Overall Valuation Growth (2007-2022): 19,900.00%
Growth from 2015-2022: 138.10%
Top 10 Valuation by Companies: Examining individual unicorn companies, Bytedance holds the highest valuation at $180 billion, followed by SpaceX and SHEIN, tied at $100 billion each. Bytedance alone contributes 25.14% to the total unicorn valuation. Valuations across the top ten companies range from $38 billion to $180 billion.
KPIs:
Bytedance Valuation: $180 billion
SpaceX and SHEIN Valuation: $100 billion each
Bytedance's Contribution to Total Valuation: 25.14%
Recommendations:
Industry Diversification: Explore opportunities for diversification within industries to mitigate risks associated with sector-specific fluctuations.
Global Expansion: Consider expanding unicorn ecosystems in countries with lower representation to capitalize on emerging markets.
Sustainable Growth: Encourage sustainable growth strategies for unicorn companies, focusing on long-term value creation rather than rapid short-term gains.
Investment Strategies: Tailor investment strategies to capitalize on the growth trends observed in both unicorn counts and valuations over the years.
Tech and Innovation: Prioritize investments in companies contributing significantly to technological innovation and disruptive trends within their respective industries.